Analysis of Electrophoresis Patterns of High-Voltage Power Supplies in Capillary Electrophoresis
In the field of modern analytical chemistry, capillary electrophoresis technology has become an important means for separating and analyzing complex samples due to its advantages of high efficiency, rapidity, and low sample consumption. The high-voltage power supply for capillary electrophoresis, as the core component of this technology, plays a decisive role in the formation and analysis of electrophoresis patterns.
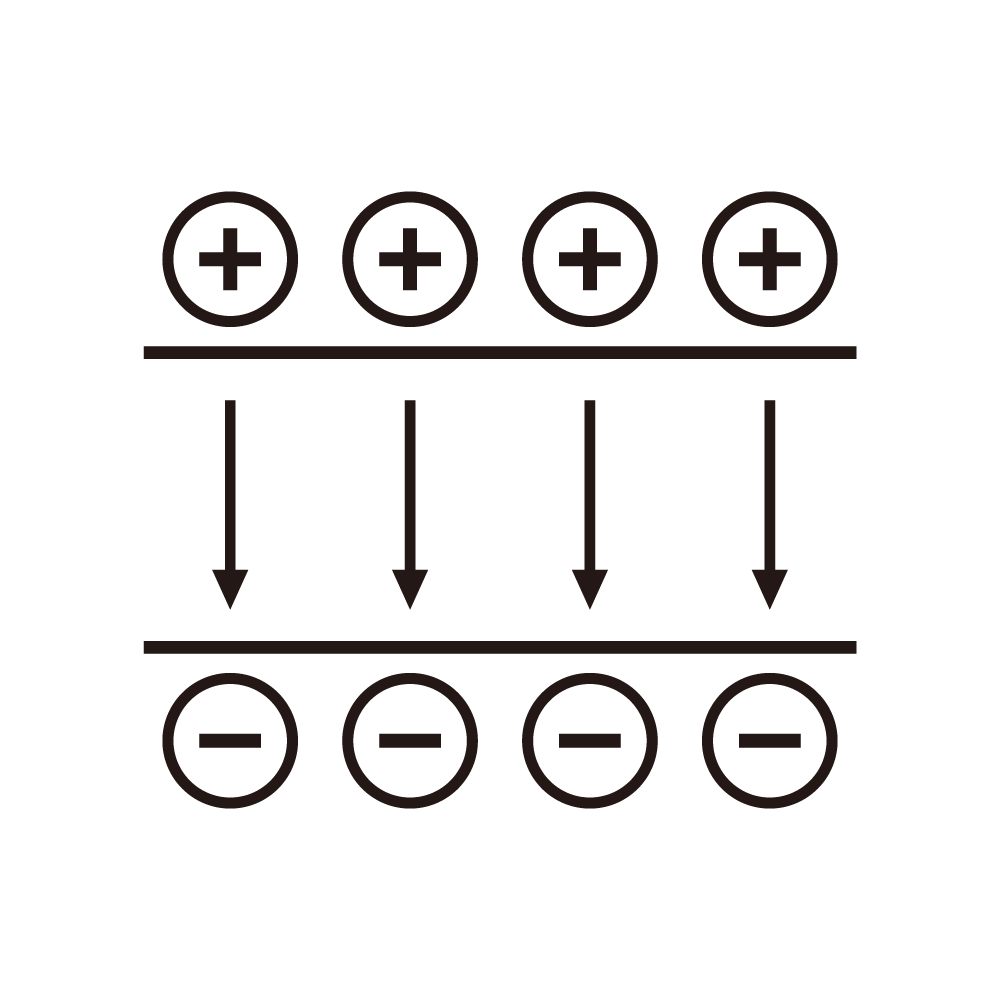
The basic principle of capillary electrophoresis is to apply a high voltage inside the capillary, causing charged particles to migrate directionally under the action of an electric field. The high-voltage power supply provides a stable and controllable electric field for this process, and its performance directly affects the electrophoresis separation effect and the quality of the electrophoresis pattern. When the high-voltage power supply outputs a stable high voltage, charged particles migrate at a constant speed inside the capillary, which is manifested as clear and sharp peak shapes on the pattern. If the voltage is unstable, with fluctuations or drifts, the migration speed of particles will change accordingly, resulting in peak broadening, tailing, or even peak splitting, seriously affecting the resolution and quantitative accuracy of the pattern.
In the electrophoresis pattern, the position of the peak contains rich information. Different charged particles have different migration speeds under the same electric field due to differences in their charge properties, charge amounts, and molecular sizes. Therefore, they will peak at different times on the pattern. By comparing the peak times with those of known standard substances, qualitative analysis of unknown components in the sample can be carried out. For example, when analyzing amino acids in biological samples, different amino acids will peak at specific times in the capillary electrophoresis pattern due to differences in their structures and charge conditions, through which the types of amino acids contained in the sample can be identified.
The height and area of the peak are closely related to the content of the corresponding component in the sample. Within a certain concentration range, the higher the content of the component, the higher the peak height and the larger the peak area corresponding to it on the pattern. Based on this, a standard curve can be established, and peak height or peak area can be used for quantitative analysis. For example, in pharmaceutical analysis, by measuring the peak areas of drugs and their impurities in the electrophoresis pattern and according to the standard curve, the content of each component in the drug can be accurately determined, providing key data for drug quality control.
In addition, the symmetry of the peak is also an important indicator for evaluating the quality of the electrophoresis pattern and the reliability of the analysis results. Ideally, the peak should show a symmetric Gaussian distribution. If the peak shows fronting or tailing, it may mean that there are problems such as sample adsorption, unreasonable buffer composition, or excessive ripple of the high-voltage power supply. By optimizing experimental conditions, such as adjusting the pH value and concentration of the buffer and checking the stability of the high-voltage power supply, the peak shape can be improved, and the accuracy of pattern analysis can be enhanced.
The electrophoresis pattern generated by the high-voltage power supply for capillary electrophoresis is like a coded map containing rich information about the sample. Through detailed analysis of the characteristics of the peak position, height, area, and symmetry in the pattern, researchers can achieve accurate qualitative and quantitative analysis of sample components, providing strong support for research and applications in many fields.


